
Dynamic Web Mapping Solutions
HTML5 Accessible Tiled data for advanced analysis
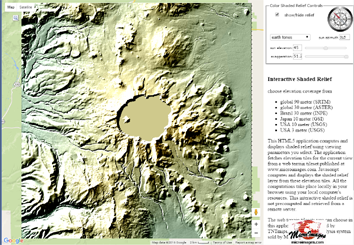
The examples here are using the Google Maps API and using elevation data in a fashion appropriate to elevation data ie generating an adjustable illusion of 3D but they are far from the only possible uses, for instance one might dynamically compute and display the difference between two years of plant growth or water flow or similar for user selected dates of available data.
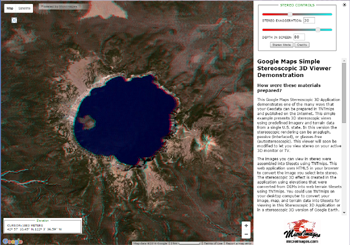
 Stereographic 3D Viewer